Ultima User Guide (c) Copyright by PaxeraHealth Corp. 2021
12.0.0. Business Analytics
In this section you will learn how the Business Analytics dashboard section of PaxeraUltima works.
The dashboard provides real-time operational performance measures that span the workflow of the radiology department; it enables the department manager to analyze the workflow within the department.
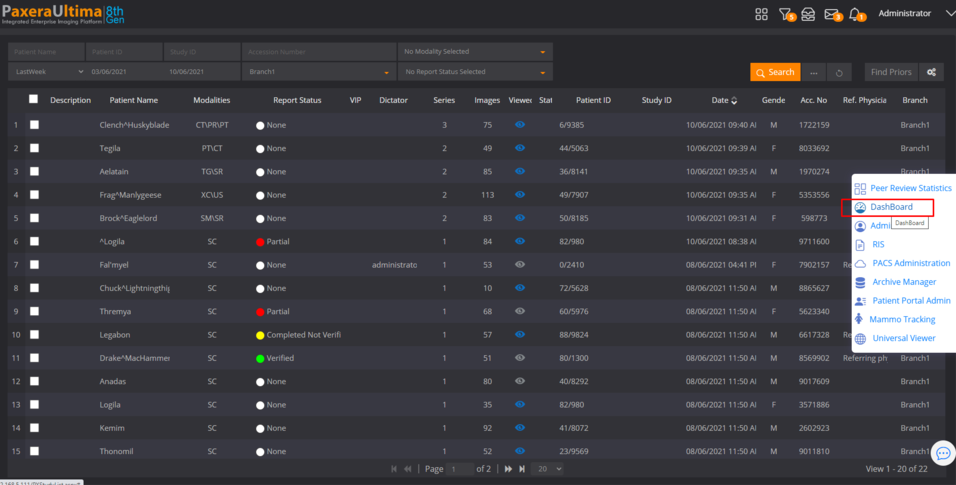
To access the dashboard, simply click on the button on the top right corner:
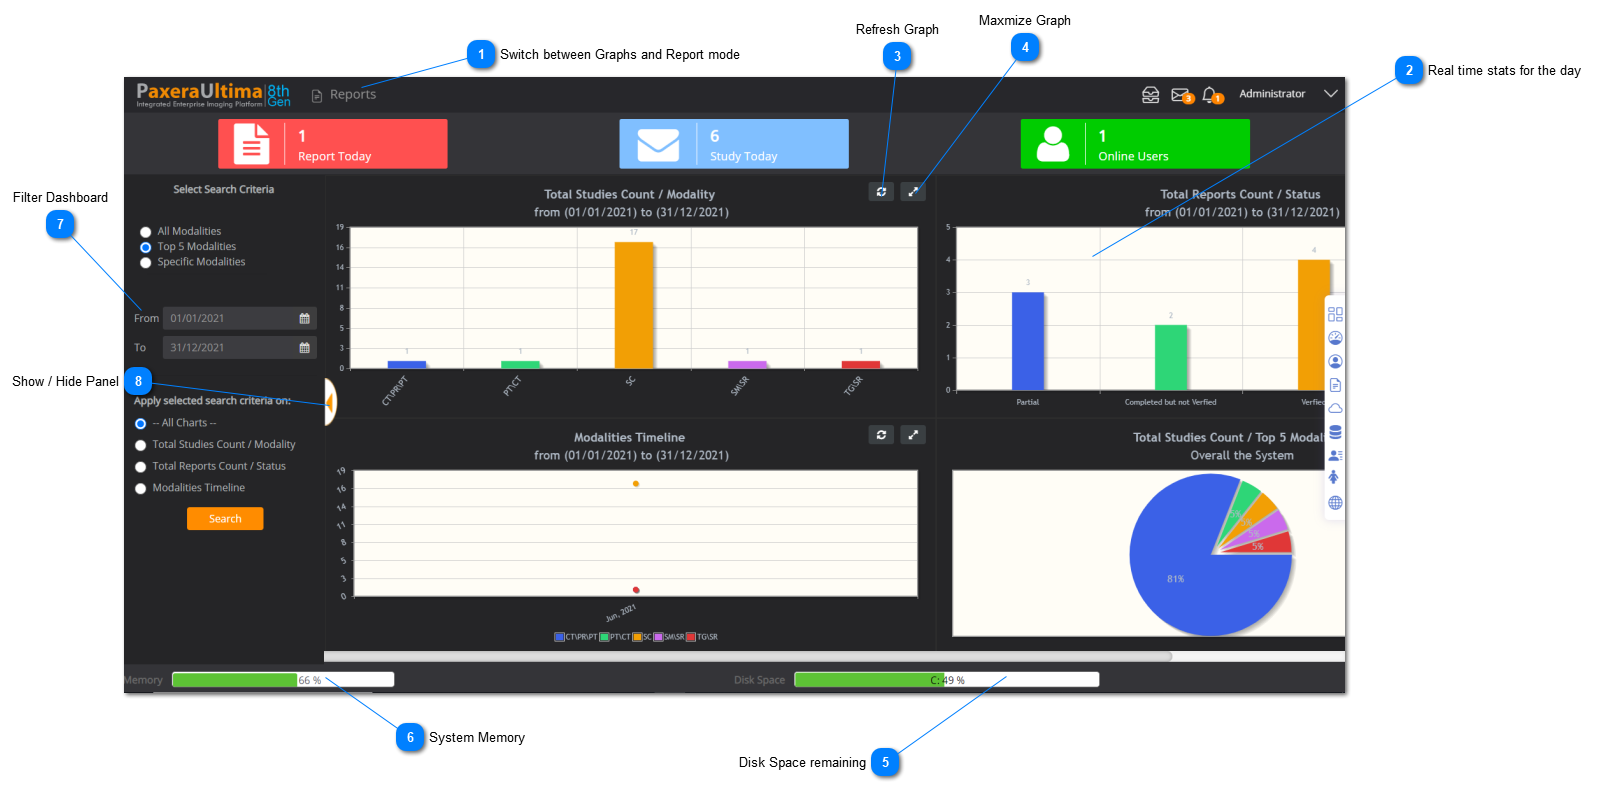
The main dashboard page will open; an overview of it is given below:
•Dashboard / Report mode- Enables the user to switch between the dashboard graphics page and the dashboard report mode.
•Real-time stats- shows the number of reports and studies done today and number of online users.
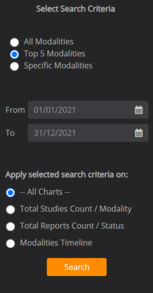
•Search- enables the user to search for specific dashboard graphics.
•Dashboard graphs- shows the user the operational measurements of the facility. Double click on any graph to enlarge it.
•Memory / disk space- shows the user the percentage of free memory and disk space. Click on the disk space bars for more disk space information.
Switch between Graphs and Report mode
The "Dashboard" is loaded by default and shows graphical information.
To create a customized report to be saved - click on the dropdown list and select "Reports":